")
Did you know? The average completion rate for mobile learning content is 80%, while that of e-learning content is around 20%. In this context, how can you analyse a course’s success or, more broadly, that of a mobile learning project?
We present 5 statistics, enabling you to better get to grips with your learners’ habits and to calculate and analyse project data in order to get the most from it.
1 – The penetration rate of your courses
How many people are consulting your training courses? The penetration rate is a very good indicator of how well you are promoting your course. A low penetration rate can indicate that you aren’t communicating enough about your course, that the course title or description is not explicit enough or that your visuals are not attractive enough. In short, this statistic can help you to identify which courses are most attractive and those which are less so.
Remember that even if your courses are beautifully crafted, if they’re not promoted well, your mobile learning project won’t get off the ground. Analysing a course’s success also involves analysing its communication strategy.

2 – The course completion rate
Do learners who start the course finish it? Once you’ve demonstrated the attractivity of your course, the completion statistic will help you to analyse whether your course is well received and if your learners are onboarded. Therefore, if the statistic shows that nobody goes beyond 20% of the course length, ask yourself whether the content is consistent with the chosen course title. If the average is 60%, ask yourself whether the course is perhaps too long?
Analysing completion data enables you, first of all, to gain an overview of your pedagogical design and to make any improvements (calibrating activities, deleting unnecessary content, etc.). Secondly, it allows you to implement a customised rekindling strategy. Using the completion rate to analyse a course’s success, means aiming to make quality the core focus of your strategy.
3 – Progression in a pathway
One of the major concerns when it comes to training is progression. Indeed, learner retention can be observed in these terms, which give a clear indication of engagement, as they put emphasis on learners’ developments and any drop-outs.
By analysing the average progression of your pathway, you can better understand your learners’ habits.
Analysing progression data will help you to highlight the average number of activities learners consume. It will also flag up less attractive content, which may stem the learning flow, create boredom or too much difficulty. What’s more, in the Teach on Mars solution, progression is not necessarily linear, you will therefore notice which activities your learners shy away from and those which are most attractive, by observing progression per module and the activity curve. If you are not yet convinced by the advantages of microlearning, this kind of statistic can be a real eye-opener.
Thanks to the average progression of your pathways, you can query or confirm your content strategy. In particular, you may opt to offer shorter content with stronger meshing, enabling your learners to extend a learning flow if they so wish (links towards another pathway).

4 – The success/failure/no attempt ratio of scored activities and of the pathway
This ratio allows you to analyse the success of a course from the point of view of its pedagogical objective (assuming, of course, that your assessment activities are perfectly in tune with your pedagogical objectives). Mobile learning uses an active pedagogy, whereby learners test out their knowledge as they learn. Your content will therefore contain scored activities for which the trainer has defined the conditions for success. In your scored activity statistics, you will always find a success/failure/no attempt ratio.
- Success v failure: this data can provide you with two pieces of information: firstly, your activity may be poorly calibrated: overly easy if you have (almost) 100% success and zero failures, overly difficult if the ratio is inverted. Make sure therefore to test out your activities on a representative sample of your learner population. If this has been done, the success/failure ratio can provide you with information about the solution your content offers to the pedagogical objective. Perhaps your course is not impactful enough or its main ideas are swamped by overly cumbersome content…
- Success/failure v no attempt: pedagogical activities can have several aims, such as positioning, anchoring, assessment, etc.; non-attempted activities can therefore serve as a valuable indicator. Assessments that are given a wide berth can reflect a learner’s fear of not being ready to be put to the test, sometimes even at the end of a course.
It can be particularly useful to analyse the number of certificates obtained – a key indicator when monitoring your training systems.
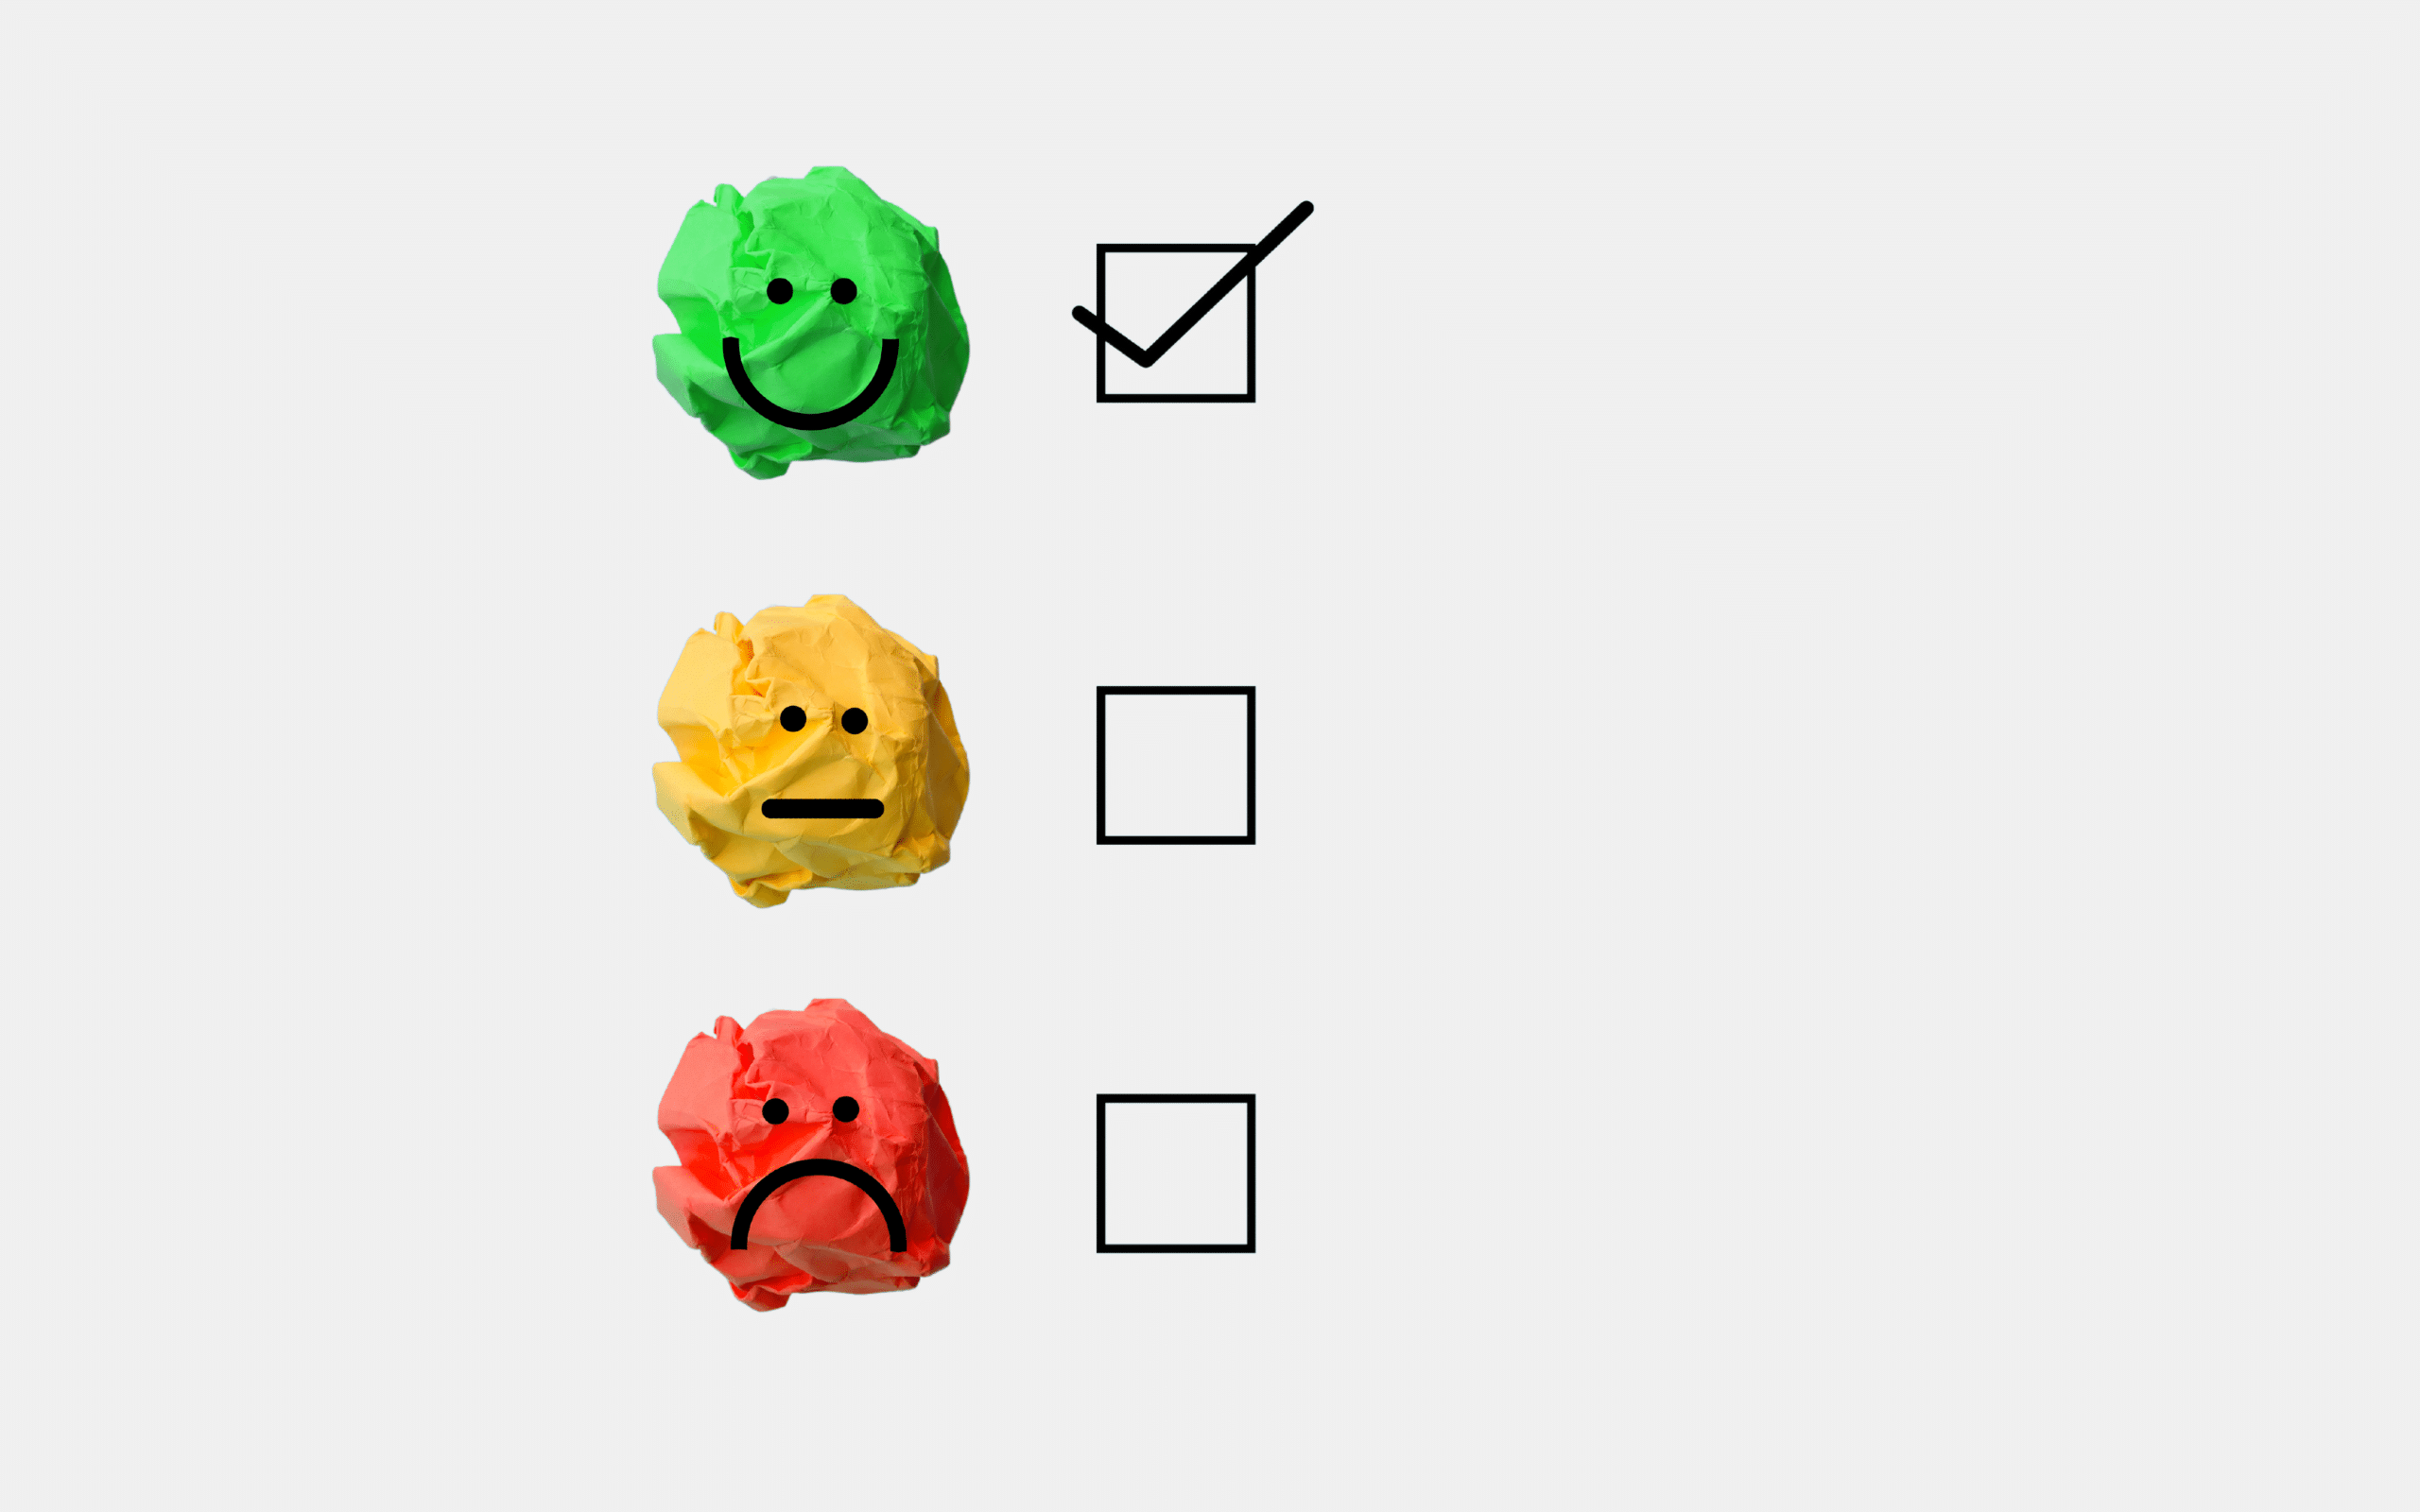
5 – Satisfaction
Learner satisfaction cannot be left out when analysing the success of a course. This feedback can be collected in the moment, by integrating a satisfaction questionnaire into the pathway (survey activity in the Teach on Mars mobile LMS) or later on, by programming a communication leading to a satisfaction survey, one week or one month after the course follow-up.
Satisfaction can be expressed in two ways:
- A scoring system enabling quantitative feedback. Thanks to the general average of your pathways, you can easily identify the pathways which are most successful and those in need of improvement.
- Qualitative feedback, or rather answers to open questions. These enable you to grasp the learner experience, aspects about the course which stood out positively and those which were considered irritating.
Analysing satisfaction data is crucial when assessing the quality of your course and the success of its deployment.
As you will have understood, analysing the success of a course requires a large amount of data. This data will provide you with information about the quality of your communication, your deployment and design. Although figures can be made to say anything, your somewhat gargantuan task is to contextualise and cross-check this data to take the best lessons from it regarding your digital learning project.

D’abord éditrice de manuels scolaires, professeure et coordinatrice pédagogique à l’Université, Julia a rejoint l’équipe Learning Experience chez Teach on Mars pour apporter ses compétences en pédagogie. La gamification et la différenciation pédagogique sont notamment ses chevaux de bataille.