Mobile learning allows you to develop the skills of your employees so they can master their jobs, learn about your company and optimise efficiency in their daily activities… But how can you validate the success of your learning system? In addition to the data provided by the administration interface of your training solution, a business intelligence tool will be your best ally.
Why use business intelligence in digital learning scenarios?
Analysing the behaviour of your learners when using their training app is a key element for ensuring the success of your mobile learning initiative. With the right dashboards, you can track your performance indicators at a glance, understand the expectations of your learners, adjust your system, improve it and make it even more powerful.
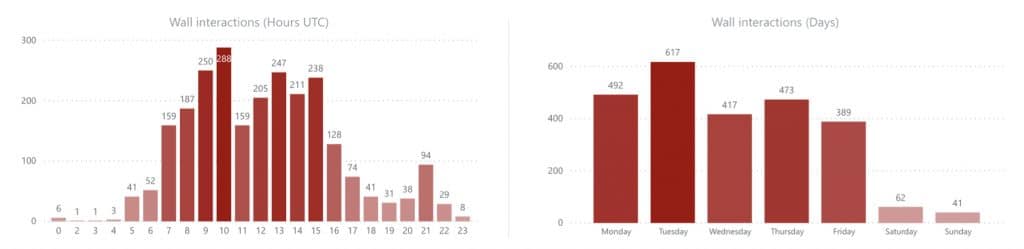
For example, by observing the days and times when your learners are most active on the Wall of their app (time spent on articles, use of bookmarks, likes, shares, comments), you can determine the best time to publish, achieve better open and share rates for your communications than you’ve ever seen, and thus reach the widest possible audience.
You’ll also be able to identify the best learners so they can be rewarded, or even identify the least diligent to engage them, for example via communications with push notifications. You’ll also find out which training and learning activities work best, and can then promote them or adapt your other content to identical templates so that you maximise appeal and meet the needs of your learning community.
Business intelligence with Teach on Mars
Although you’re completely free to use whatever data you want to produce business intelligence, Teach on Mars has created a set of dashboards (on PowerBI) so that you can quickly track the indicators we consider to be key! So what questions will Teach on Mars business intelligence allow you to answer? Here are just a few.
Use of your app over a given period:
- The channels used by your learners (web, iOS, Android, all three?)
- The number of training courses started and/or completed
- The average basket of training items (activities, communications, etc.)
- How often your application is used
Communication effectiveness:
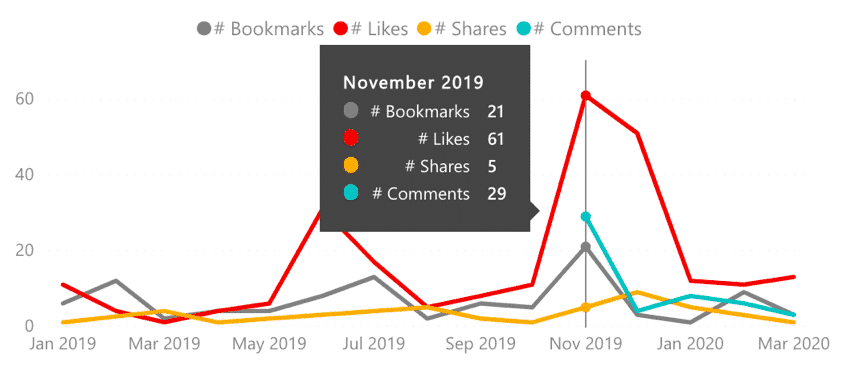
- What types of communication are most looked at?
- When do your learners look at them?
- What interactions do your learners have with communications?
Who your learners really are:
- Who are the most active learners over a given period?
- Who has won the most points?
- On average, how many training courses do they do?
- How much time do they spend?
- At what time of day do your learners do their training?
- Do they automatically engage in learning opportunities?
Hidden aspects of your training courses:
- Which categories are most used?
- Which training courses are bestsellers?
- What is the average progression of learners on different courses?
- How many learners complete courses? How many become certified?
- What types of activity are most often launched?
This list is not exhaustive but it already gives you an idea of the secrets that can be revealed.
What does the Teach on Mars business intelligence offer consist of?
The “BI” package offered by Teach on Mars allows you to connect your business intelligence tool to your Mission Center to increase the ways in which your training statistics can be analysed: study your data over specific periods, filter by several customised fields at the same time, aggregate it with data from your other tools, etc. Here’s the full rundown of our “BI” offer:
- Availability of all Mission Center data: Exported daily or weekly (depending on the option you choose), all Mission Center data is stored in a secure space accessible to you, ready for use in the “BI” tool of your choice (Table, PowerBI, etc.)
- Predefined dashboards on PowerBI: So that you can get started straight away, we offer several dashboards (some of which you will have seen in this article); these are specifically designed to analyse your learning system both rapidly and in depth, so you can keep improving it. (These tables are only available in PowerBI.)
- Support from your Customer Success Manager: Specialists in the art of optimising our customers’ mobile learning programmes, our experts teach you how to analyse your training data, adjust your dashboard parameters, and provide you with all the methodological support you require during the initial weeks.
Ready to make the most of your training stats? Contact-us !

Delphine accompagne depuis plus de 20 les organisations dans leurs grands projets de transformation. Après une première expérience de 7 ans dans le conseil sur des dispositifs d’accompagnement au changement (mise en place de nouveaux modèles d’organisation, accompagnement des collaborateurs dans le cadre de fusions, évolution de pratiques managériales/RH…), elle a intégré le groupe Crossknowledge en 2005 et déployé une offre de services novatrice pour assurer le succès des projets de digital learning dans les grands groupes. Elle a rejoint ensuite Teach on Mars en 2018, et en est le COO depuis 2021. Elle pilote actuellement le développement du portefeuille de clients existants ainsi que les activités de notoriété de la marque.